The following is a summary of work I completed in Splunk which included creating custom reports, alerts and dashboards.
Specifically, the tasks included:
- Developing a custom monitoring solution to report and alert on suspicious activity from windows events + apache logs.
- Created dashboards with multiple visualisations to provide in depth analysis of attack signatures (this will be discussed below).
I then conducted a simulated attack and analysed the results to determine the effectiveness of my monitoring solutions.
Technologies Used:
Splunk: {Reporting, Alerting, Dashboards}
This project covered a wide range of topics including:
- Information security continuous monitoring (ISCM)
- Log types and their use for monitoring
- Log aggregation and correlation
- Baselining
- SIEMS
- Splunk:
- Splunk processing language (SPL)
- Reporting
- Alerting
- Dashboards
- Add on applications (splunk security essentials and machine learning toolkit)
Project requirements (process followed)
- Loaded windows and apache logs into splunk
- Analysed the logs to determine baselines and thresholds
- Created reports, alerts and dashboards for specific criteria
- Loading windows and apache logs that contained a simulated attack
- Analysed the attack logs with my splunk environment to determine its effectiveness
Determining baselines and thresholds for my alerts
I analysed the company’s regular historical activity to determine its normal average range. I then created an alert threshold outside of this normal range to prevent any false positives.
Modifying thresholds after an attack
After the attack, my alerts were triggered on the suspicious volume of failed activity as well as an above average number of successful logins. However, my alerts did not trigger the significant change in account deletions. When analysing the attack logs from my dashboard, all of the charts changed in alignment with the results in my searches.
When analysing the attack logs, the following occurred:
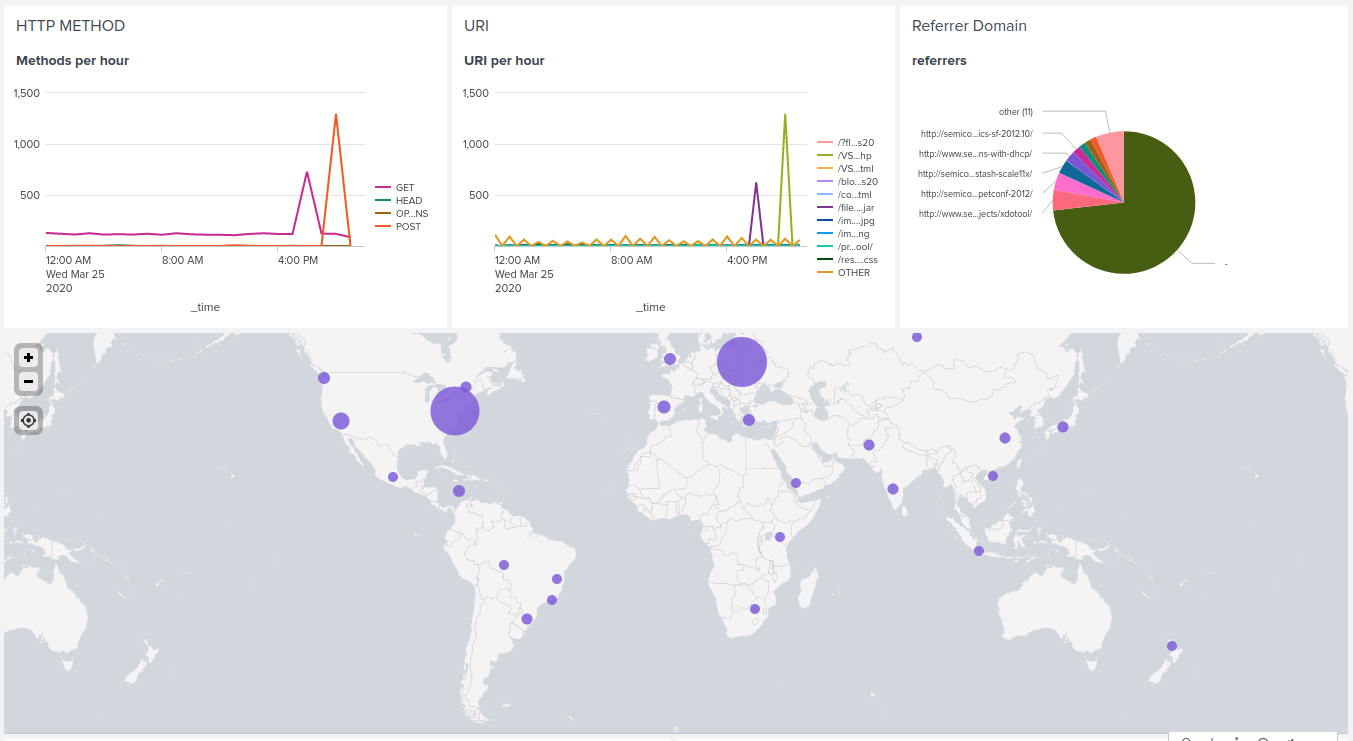
- There was a significant increase in GET followed by POST activity
- Total count of referrer domains decreased whilst percentages remained unchanged
- Significant increase in server response code 404
- There was a change in source IP’s (more traffic from Ukraine)
Thus, my thresholds were accurate as they were triggered for the increase in 404 response code levels correctly and would not have triggered a false positive. The same can be said for the increase in HTTP POST activity also.
Attack summary
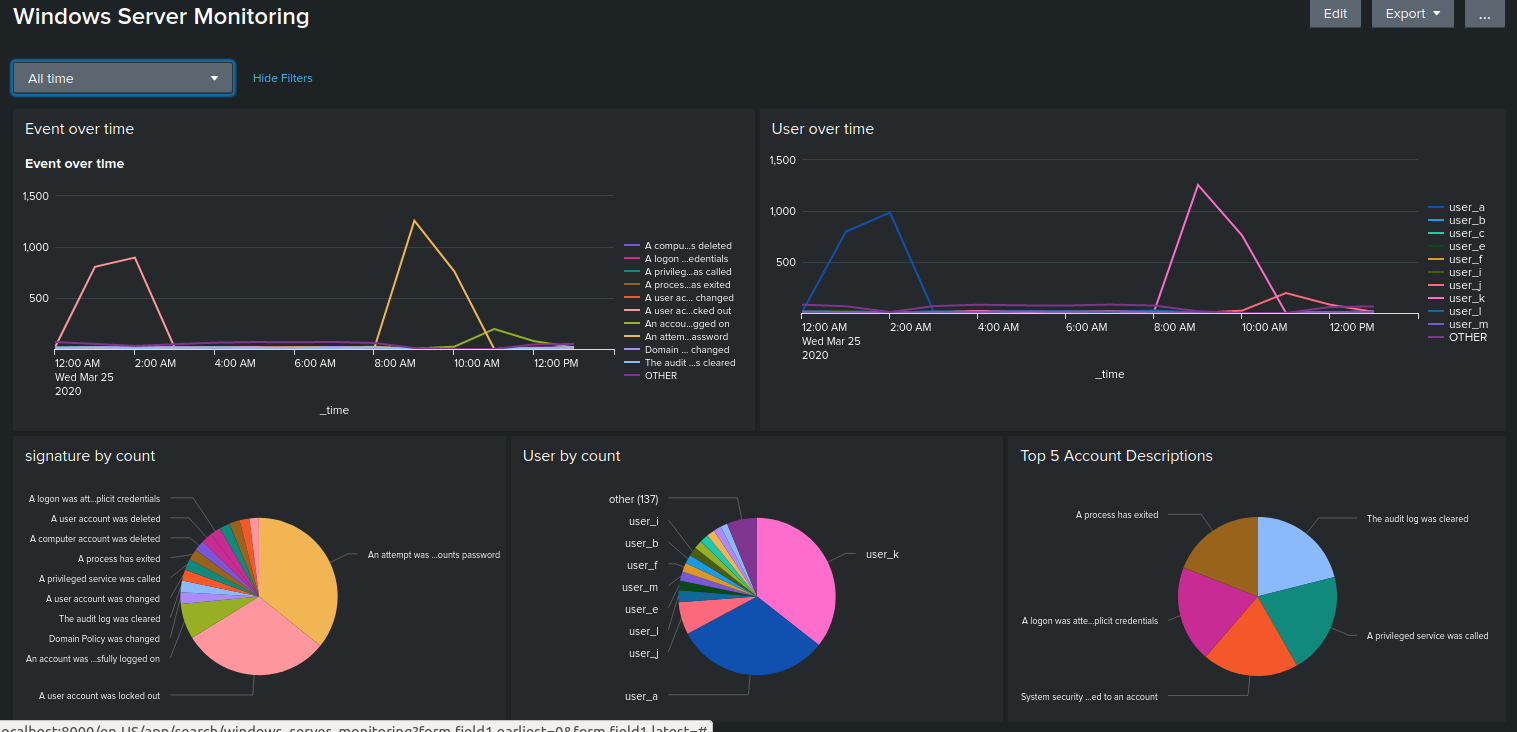
The dashboard before the attack showed standard, expected data and was quite clearly showing no outliers
When the attack was implemented, the dashboards visibly showed the major spikes for both the user logged in and the activity they were trying to access
The only downside I could see was not being able to easily view the before and after effects on the one dashboard, though this would be mitigated in a real life scenario with the relative time of attack more likely being over the last few days